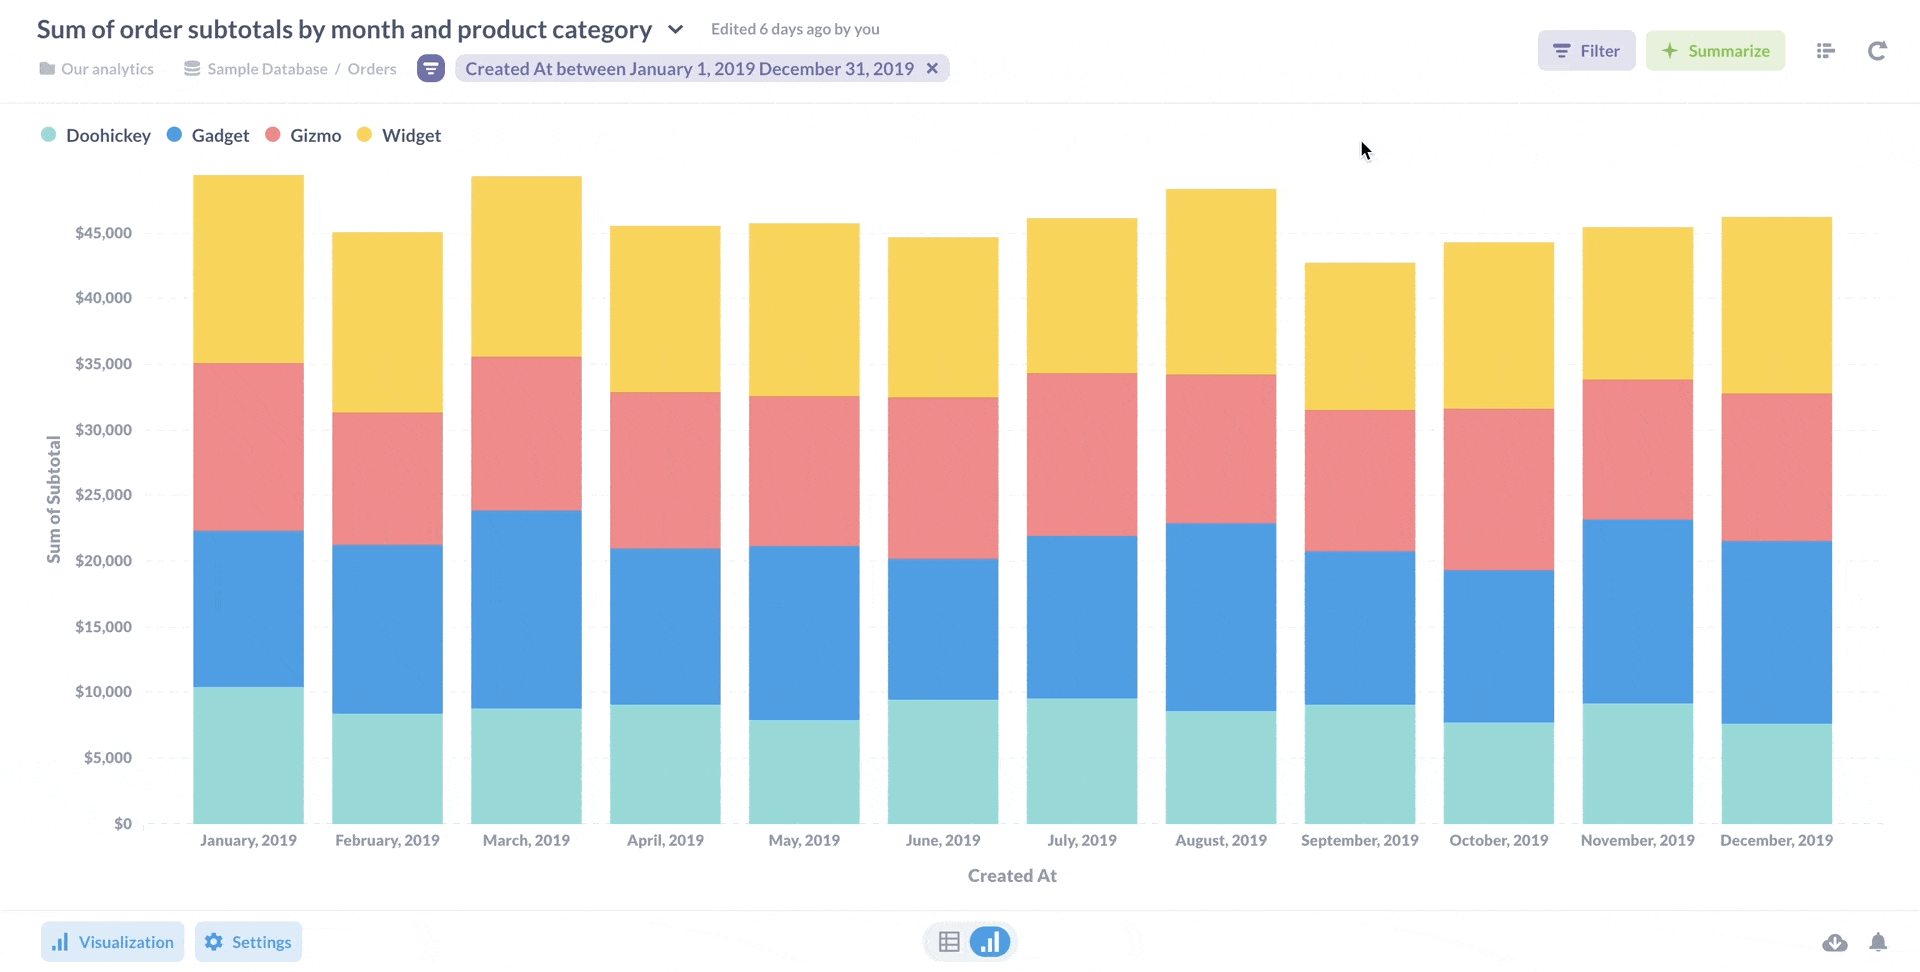
A breakout is the grouping of aggregated results, like the count of users grouped (or broken out) by country. The column you choose to group by is known as a breakout column.
You can break out your data when drilling through on a chart. Clicking on a chart like this brings up the drill-through menu, where you can further break out your data. In this example, we’ve used the action menu to break out a subset of our data by the Vendor of the product ordered.
Different charts will have different breakout options, such as Location and Time.